Categories
Science and technology

Australia’s east coast cyclones: Using fifty years of data to explore future risks 

January 18, 2023

Tropical cyclones (TCs) near the east coast of Australia have in the past demonstrated the capacity to cause vast damage to both human infrastructure and the natural world. In fact, TCs were responsible for three of the top five most expensive natural disasters in Australia from 1966 to 2017 – and two of these tracked in the eastern basin of Australia, as shown in Australian Bureau of Meteorology (BOM) records. These TCs usually have genesis in the Coral Sea, and in the light of a changing climate, scientists at Griffith University have recently examined the historical tracking behaviour of Coral Sea TCs, over fifty years. This was done in order to better understand the hazard they may present in the future, based on location along the coast.

There is much in the collected historical track data that could be used to further our understanding of TC tracking trends in this region. In particular, we attempted to find out whether the tracks had spatial properties (like curvature and latitudinal and longitudinal variance) that could be grouped. Cyclone wind speed was considered as a weighting factor so as to give due consideration to the hazard presented by the cyclones when creating and determining the position and orientation of the groups.

The mathematical clustering technique we used for this grouping did produced three well-defined and separated groups of tracks which showed diverging historical trends that can be used to project the future TC threat in this region on a group (or cluster) basis – it seems each group has a differing and diverging set of trends, in comparison to the others.

"Cluster 1 ... track (s) predominantly south-east, occasionally making landfall. It is this cluster that is most likely to impact the South-East Queensland coast due to its location and predominant tracking direction."
East Coast Cyclone data
TC tracks with centroids clustered by first moment (track centroids). TC tracks with maximum windspeed indicated by graduated colour scale and positions of individual track centroids, as indicated with crosses, with associated track cluster groups indicated by centroid point colour. Cluster variance ellipses also indicated by colour - illustrates mean area transgressed, mean orientation and mean shape for each cluster
Cyclone clusters explained

The clusters were numbered 1 to 3 from east to west:

  • Cluster 1 was centred in the Coral Sea, was the most south easterly located group. The TCs in this group track predominantly south-east, occasionally making landfall. It is this cluster that is most likely to impact the South-East Queensland coast due to its location and predominant tracking direction.
  • Cluster 2 was centred in the Coral Sea closer to the coast than group 1. The TCs in this group track predominantly laterally along easterlies, occasionally making landfall.
  • Cluster 3 was centred on the western edge of the Gulf of Carpentaria. The TCs in this group track predominantly overland in a west-south-west direction, usually making landfall. This cluster is interesting in that the cyclones often travel long distances overland over the northwest of Australia – a previous study into these unique-to-Australia overland travelling TCs suggested that they regained energy from the moisture in the soil which was used to propagate long distances. Due to their long tracks, this group of cyclones had the highest dissipated power index of the three.
Predicting future risks

Although the majority of previous studies show a decrease in TC frequency for the South-West Pacific, historically and projected, interestingly only 1 of our groups showed this trend – cluster 1. This cluster has TC tracks that travel in the most southerly direction. We did not see evidence of frequency of occurrence reduction over the last 50 years for clusters 2 and 3.

In addition, although the Coral Sea TCs did not show an historical trend in power dissipation as a collective (though other recent studies do show an increase in the power of category 4 and 5 cyclones in this region), cluster 2 in isolation demonstrated a dramatic increase in this characteristic post 2004, as well as an increase in curvature over the 50-year period. It also seems from our results that the location of maximum intensity of the cluster 2 tracks is moving poleward which was not evident in the other groups.

Our work has highlighted that since around the start of the new millennium, TCs that track in the area defined by cluster 2 are showing a clear increase in hazard, when compared to the other clusters (when considering power dissipation, curvature, location of maximum intensity, landfall probability and lack of frequency reduction).  

Author

John Miller
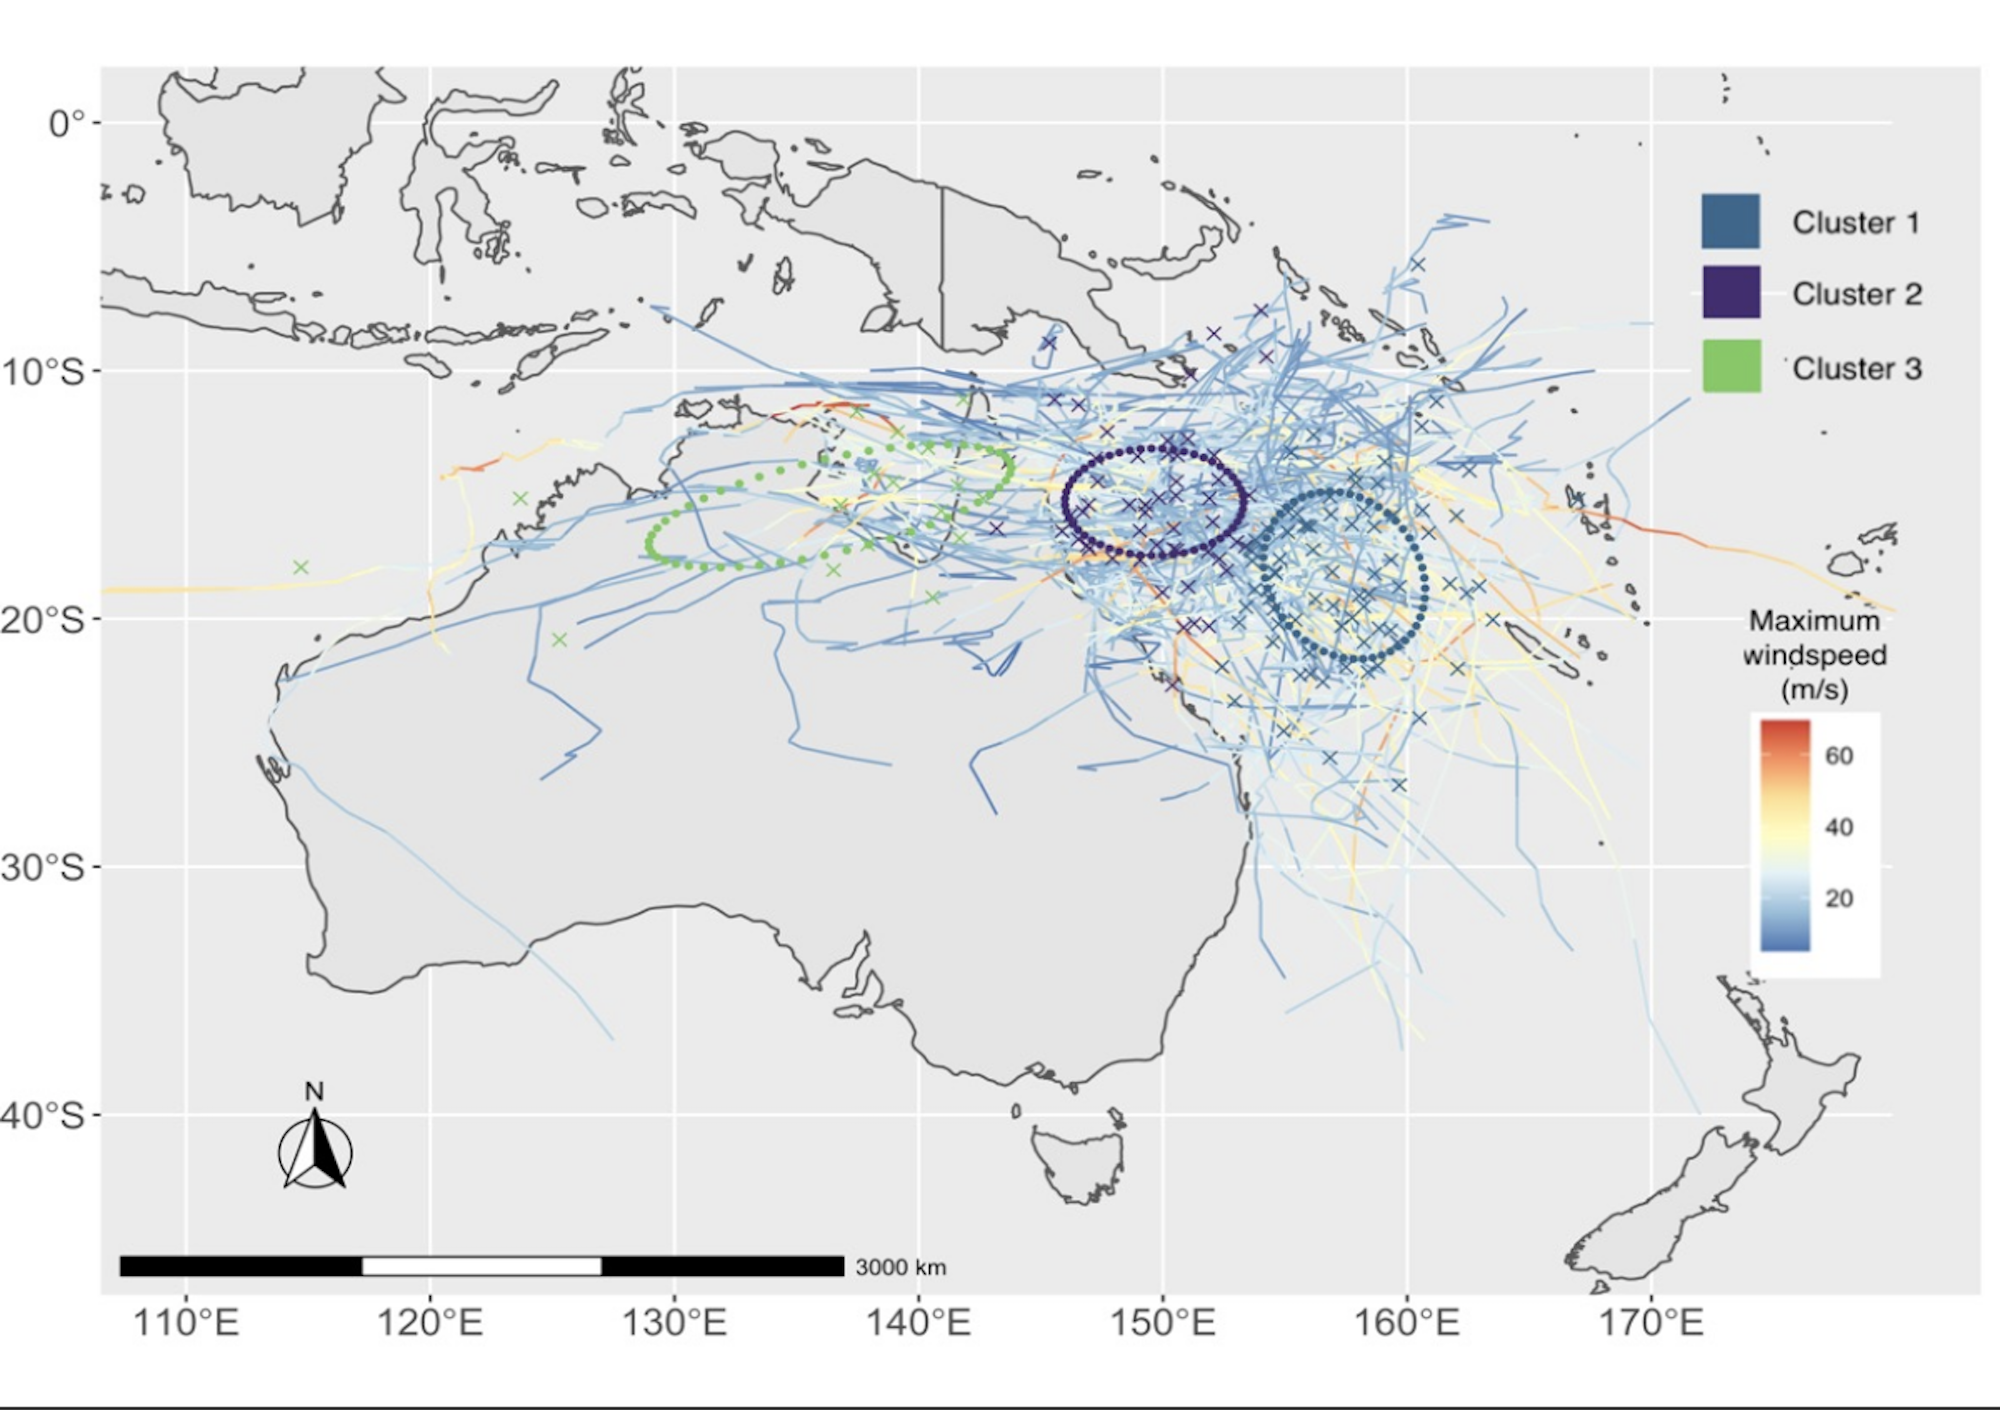
John Miller is a PhD candidate in the School of Engineering and Built Environment, working with the Coastal and Marine Research Centre at Griffith University. He was a reliability engineer for over 25 years and then completed a graduate diploma in Environmental Science at Griffith University, where he began a study of extreme storms in the Coral Sea. This study then became a basis for his PhD.

Share
Share
Share

You might also like

Pacific currency

Queensland steps up Pacific engagement

The key to progressing Queensland’s position as Australia’s “Pacific state” is to focus on the concept of shared value. The Queensland government is uniquely placed to build on geographical, historical, economic, and cultural ties to work in ways that are not captured by the deficit lens that so often infects perceptions of the Pacific islands region.

Read more